Data for Biodiversity

Explore biodiversity data through visualization.

Get Started

Built with Plotly Dash

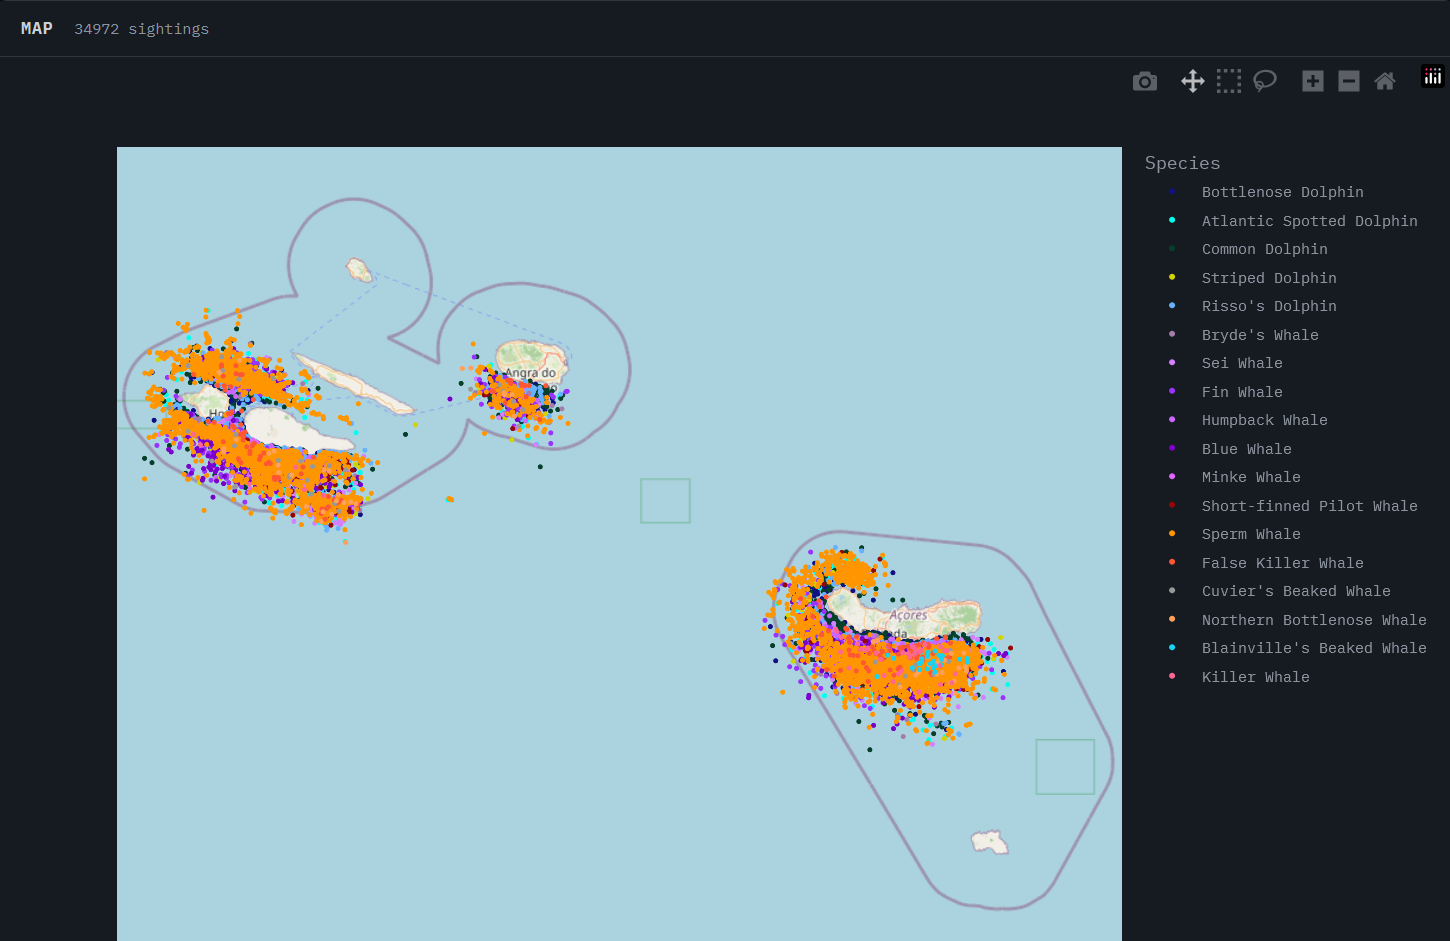
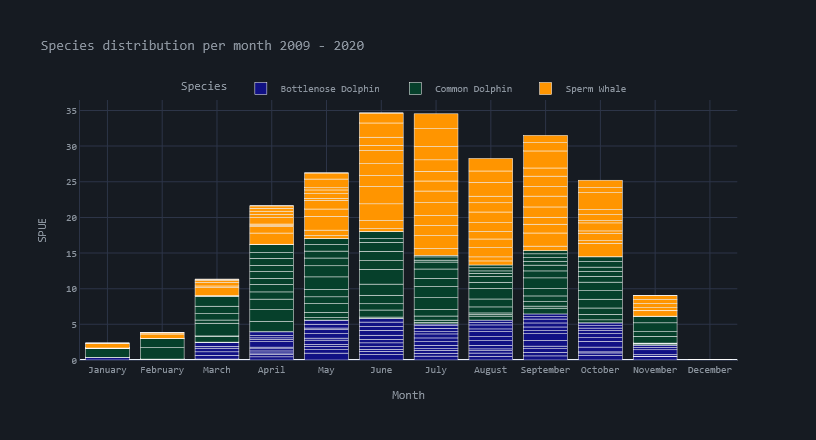
Building a dashboard with the open-source version of Plotly - Dash is a simple way to turn raw data into interactive web apps using Python. You bring the data—we bring the tech (and the know-how) to make it actually readable, clickable, and a lot less scary than a spreadsheet.

...
...
...

Maps

We help you explore the world through smart, interactive maps designed to make location data simple and useful.

...

Charts

We make your data come to life with intuitive, easy-to-read charts that tell the story behind the numbers.

Address


Email


info(at)data4biodiv.org